Supervised Learning
AI Series - Chapter 3

I am a software engineer.
print("Supervised Learning")
Supervised Learning is a type of machine learning task that uses labeled input data to train a model. Several inputs pass through a model to predict an output.
Here input data is the data used to train the model and output is the information the model brings out as a result or a prediction.
Labeled data here means data with a label(name). An example of labeled data is a basket of fruits each having a name written on it like an orange, apple, or mango. On the other hand, unlabelled data is having a basket of fruits without names. Below is an image depicting labeled data.

Supervised Learning works like so; Say we want to train a model we'll need to know some details about the data. Let's say we want our model to recognize oranges, we'll need to show it several images of oranges represented as a sequence of numbers. So when we show it new oranges it'll be able to predict whether it is an orange or not.
Input data are called Features or Feature Vectors. Vectors are simply lists or arrays which are datatypes used to store data in programming that look something like this: [orange, pear, banana]
There are two types of Features:
Qualitative: This type of feature is based on categorical data, data with a finite number of categories or groups. Examples include genders like male and female, colors like red, yellow, and green, or cities like New York, London, and Kigali.
Now this type of data needs to be represented in numbers, the language the computer can understand.
There are two types of qualitative features:
Nominal Data: This is data with no inherent order. Like a list of fruits or countries. It doesn't matter if I order orange before mango or vice versa.
To represent this type of data we can use a technique called one-hot encoding**.** One-hot encoding works based on the premise that if an item matches the category make it 1 else 0 like so:
Say we want to represent these fruits [orange, pear, banana] since we have 3 items in the list we'll use 3 digits: [100, 010, 001] now 100 represents orange, 010 pear, and 001 banana. Now we're speaking the language the computer understands 😊

Ordinal Data: This is data with inherent order. Like age groups and ratings. For example, a rating like so "strongly disagree," "disagree," "neutral," "agree," and "strongly agree,". This can be represented as 1, 2, 3, 4, and 5 if the scale of the rating is 1-5.
Quantitative: This type of feature uses numerical valued data (could be discrete or continuous). For example age, temperature, height, and weight. We can use these types of features directly to train our models without any need for preprocessing since they are already represented in numbers.
A supervised learning dataset is a list(array) of feature vectors. A features dataset consists of rows and cols as in a table.
Each row is a different sample in the data or a feature vector. Each column is a different feature.
Check the diagram below.
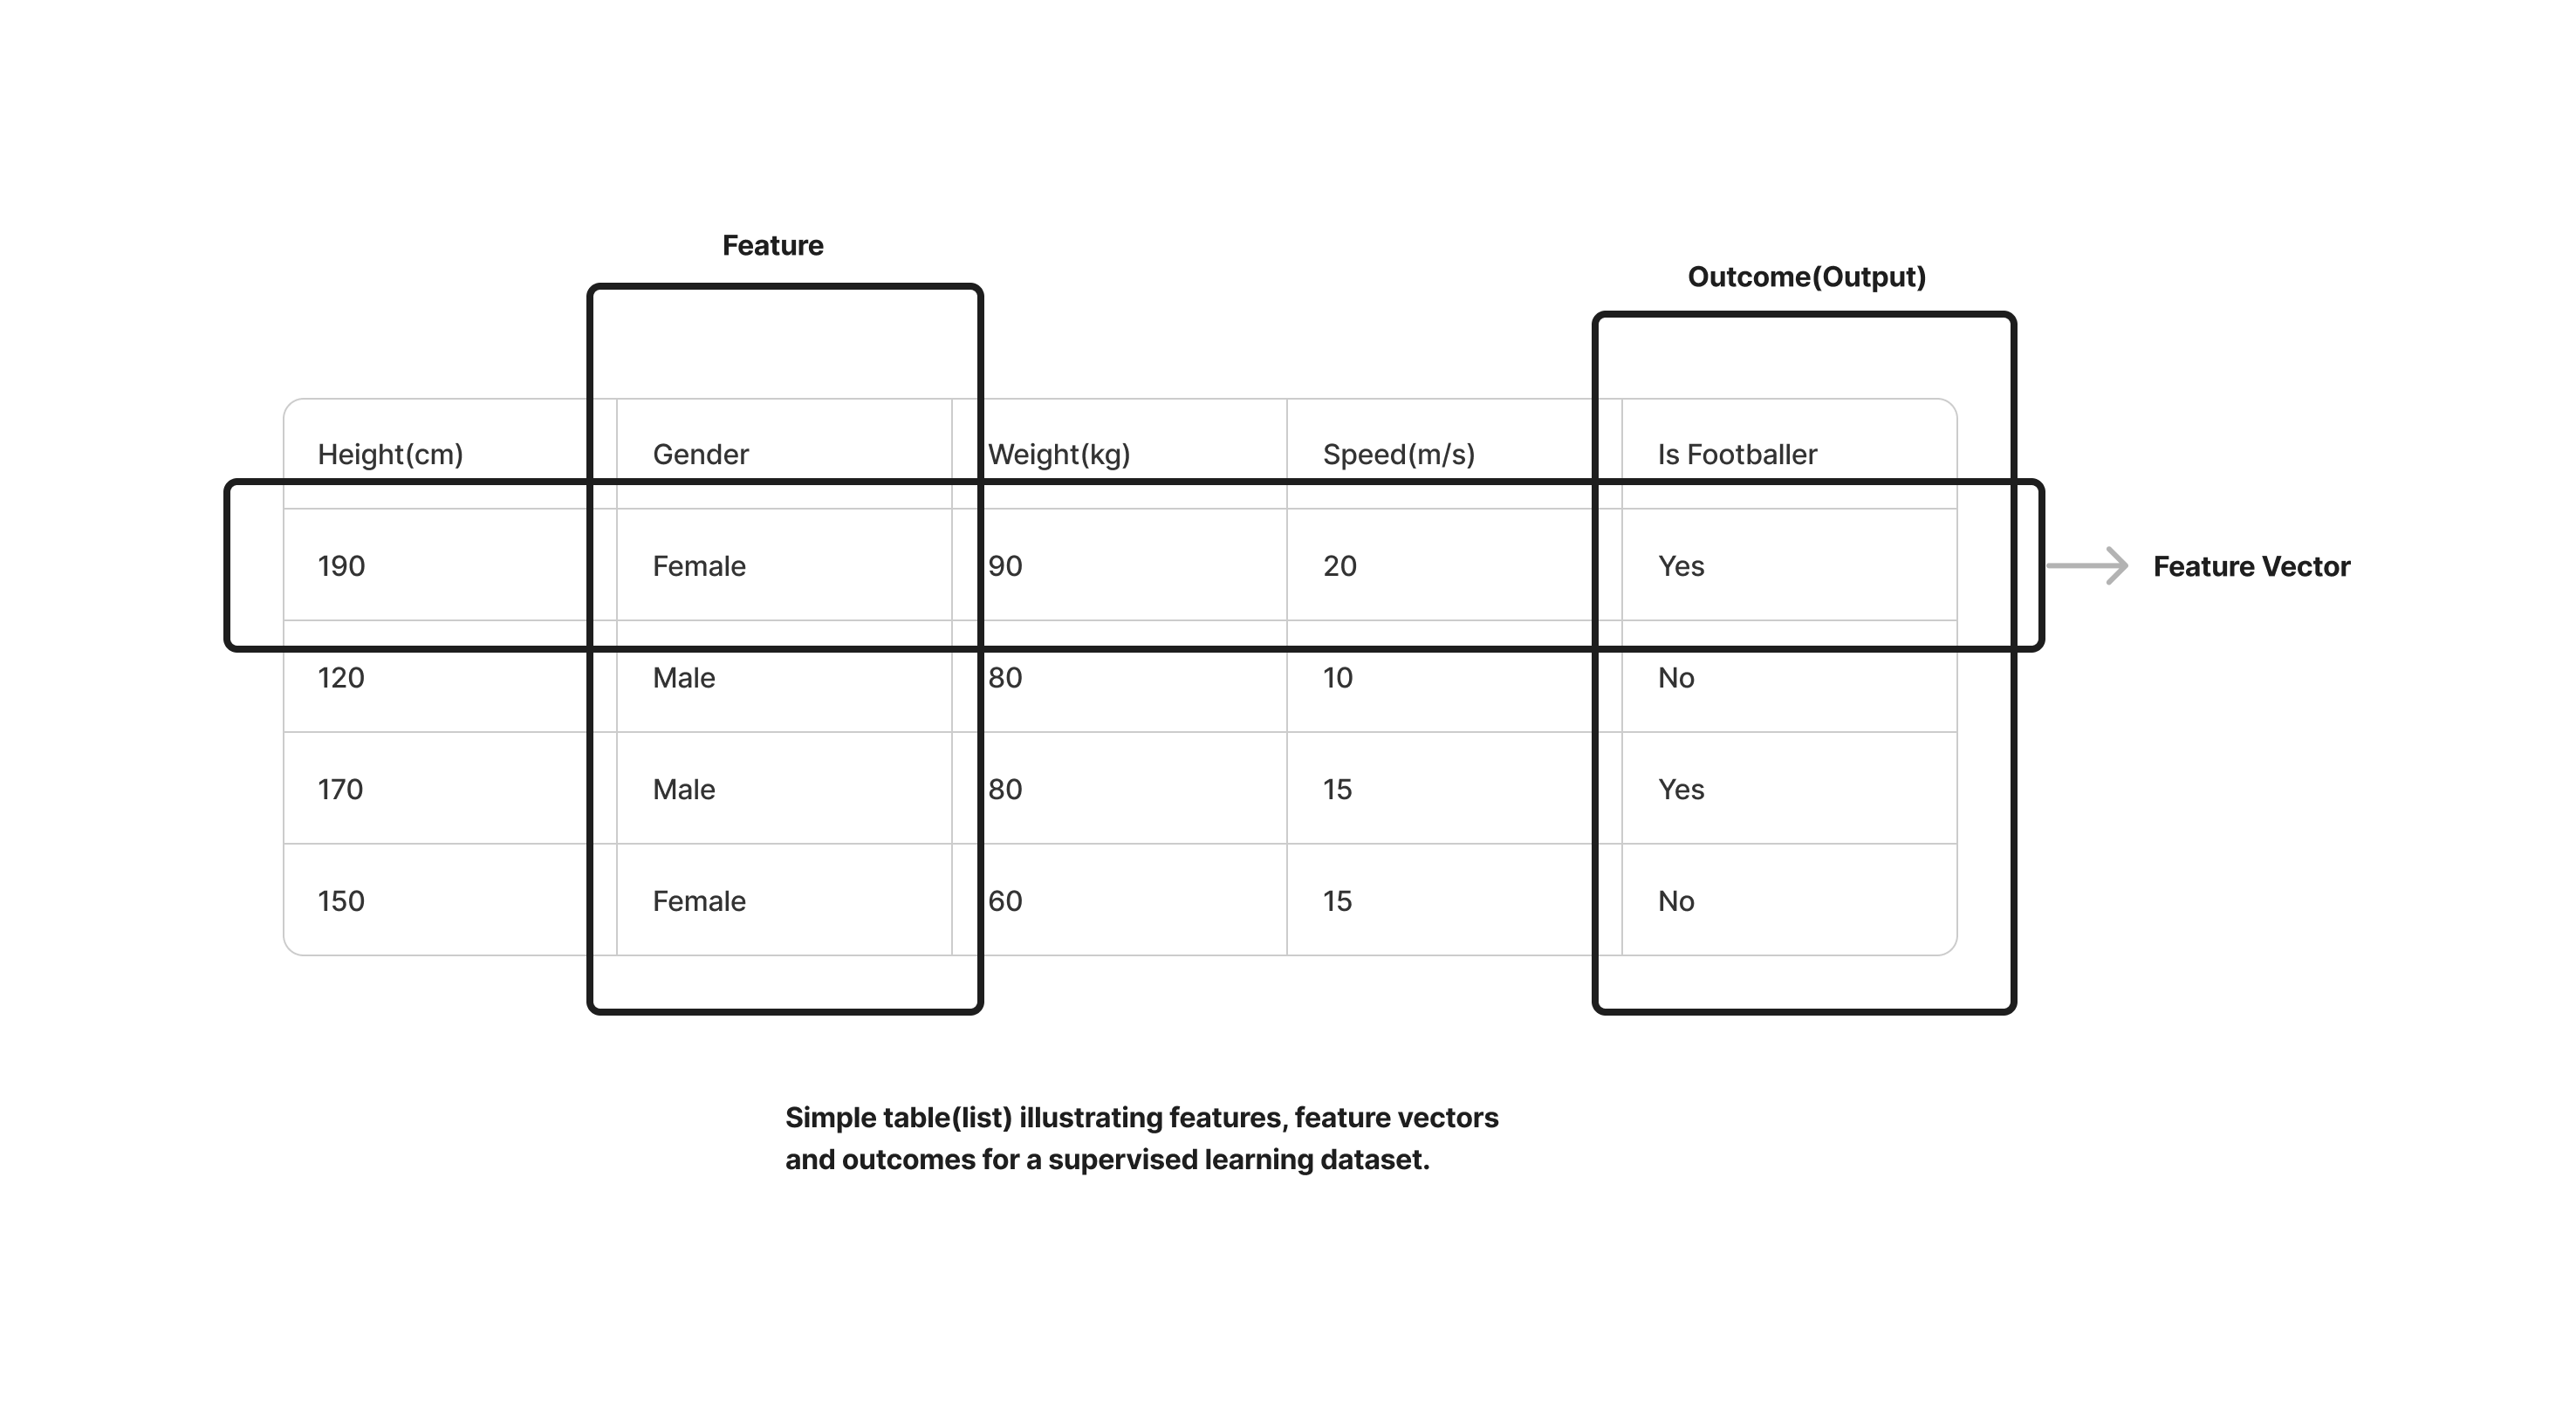
In the illustration above we can see that the feature vector is a list of features, labeled. A feature here is gender another is height and so on. The outcome here is the output or prediction we are looking for. So here we have a list of features, and we want to be able to train our model based on these features and outcomes so that it can be able to predict if a person is a footballer or not based on this dataset.
When we have a labeled dataset before we can start training our model we'll need to split the dataset into 3 parts:
Training Dataset: This is used to train our model.
Validation Dataset: This is used to check the loss against the accuracy of the model.
Testing Dataset: This is used to get the final performance of your model.
The dataset can be split in an 80%-10%-10% or 60%-20%-20% format as training-validation-testing data respectively as appropriate. We'll see this in "action" when we start training our own models.
Another important factor that helps us determine how good our model works at prediction, is loss.
Loss and Loss Functions
Loss is the difference between the predicted value and the actual value or outcome. In very simple terms if our model predicts that an outcome is 50 while the actual outcome is 60 the loss could be said to be 10.

Loss decreases as the performance gets better. Training of models is an iterative task, so when you get a loss of 10 and you make some adjustments and get another with a loss of 5, we know the second model with a loss of 5 has better performance.
Since we are computer scientists now, to calculate loss we came up with some math formulas, which we call Loss functions 👽.
We'll talk about 3 of those loss functions:
L1 Loss: This is the absolute difference between real and predicted values. This means if our loss is calculated like so; 50 - 60 = -10, absolute difference means we don't need the negative sign just the difference, which is 10.
The formula:
loss = sum(|yReal - yPredicted|)
The pipe character "|" here means that the value of the operations within it should be finally evaluated as the absolute value.
L2 Loss: This is the square of the absolute difference
The L2 loss builds on the L1 loss by squaring the difference between real and predicted.
But why should we square the difference? Because if the predicted value is far it exposes it quadratically.
Using the example we used in L1 Loss if the absolute difference for L1 is 10 that of L2 would be 10^2 = 100. We can see how the loss is magnified.
The formula:
loss = sum(|yReal - yPredicted|^2)
Binary Cross-Entropy Loss: This is mainly used to calculate the loss in binary classification models when the output is between 0 and 1. We won't talk about this in detail here.
We now know about loss and loss functions.

In supervised learning there are two major types of learning:
Classification
This type of learning uses discrete classes to make predictions. These use qualitative feature vectors.
Regression
This type of learning uses continuous values to make predictions. These use quantitative feature vectors.
We now know what supervised Learning is all about and a little more too about Machine Learning already, if you've been following the previous chapters 🤖.
In our next post, we'll go on to discuss one of the types of Supervised Learning; Classification. Stay tuned, we're close to training our first model, subscribe and share!👽
PS: If you tried to subscribe or follow this blog and had issues please try using a VPN to switch your location. It's an issue from Hashnode, hopefully, they resolve it soonest.